Introduction
Gene Set Enrichment Analysis (GSEA) serves as an advanced computational tool frequently employed for the analysis of genomic data and transcriptomic data. This method determines if particular collections of genes, termed gene sets, exhibit statistically meaningful variations in expression levels when comparing two distinct biological states. By concentrating on the collective behavior of genes rather than analyzing them in isolation, GSEA facilitates a deeper understanding of the overarching biological processes. Consequently, researchers are better equipped to decipher the implications of extensive gene expression datasets.
What is Gene Set Enrichment Analysis?
Definition and Purpose
GSEA is a method employed to assess the enrichment trend of a specified set of genes within a gene ranking that correlates with a particular phenotype, thereby establishing the gene set's role in the manifestation of that phenotype. The analysis requires two primary inputs: a collection of genes characterized by their known functions and a matrix detailing gene expression levels. The GSEA algorithm orders genes by their degree of association with the phenotype, as reflected by variations in expression, from highest to lowest correlation. Subsequently, the software examines if the genes within each category of the gene set are clustered towards the beginning or end of the ranked list. This process reveals the influence of the collective expression changes within the gene set on the observed phenotypic differences.
Historical Background
GSEA was first introduced by researchers at the Broad Institute(Subramanian A.,et.al,2005).This novel strategy transitioned the analytical focus from individual genes to the collective actions of pre-defined gene sets, fundamentally establishing the basis for pathway-centric approaches within the realm of bioinformatics. Before the advent of GSEA, the examination of gene expression datasets was largely centered on detecting differentially expressed genes (DEGs) across various biological contexts, such as comparing healthy to pathological conditions. Although informative, this approach frequently failed to consider the networking of genes within biological pathways. Since diseases often entail synchronized modifications in the expression of numerous genes rather than changes in individual genes alone, investigators encountered difficulties in comprehending the complex data emanating from technologies like DNA microarrays and RNA-Seq.
Understanding Gene Sets
Gene sets are predefined collections of genes that are grouped together based on their association with specific biological pathways, processes, or molecular functions.
Gene sets are typically derived from various biological databases that curate and annotate genes based on their functional roles. One of the most prominent resources for gene sets is the Molecular Signatures Database (MSigDB), which contains thousands of annotated gene sets for use in GSEA(Liberzon, A.et.al). The MSigDB categorizes gene sets into several collections, including:
- C1: Genes located in the same chromosome or cytogenetic band.
- C2: Canonical pathways derived from established biological pathways, including those from well-known databases like KEGG and Reactome.
- C3: Sets of genes sharing cis-regulatory motifs, which may indicate common regulatory mechanisms.
- C4: Clusters of co-expressed genes identified through computational analysis of large expression datasets.
- C5: Gene sets corresponding to terms in Gene Ontology (GO), which classify genes based on their biological processes, cellular components, and molecular functions.
Key Differentiators
Unlike traditional single-gene analyses, GSEA evaluates gene sets as a whole, which reduces noise and highlights biologically relevant patterns. This provides a more holistic view of gene expression changes.
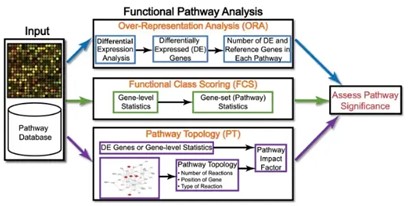 Figure1.Current gene enrichment analysis methods(Figure come from github).
Methodology of GSEA
Principle of GSEA
In the context of a gene list L that has been sequenced and a pre-established gene set S (which may include genes associated with a specific metabolic pathway, genes in close genomic proximity, or genes sharing a common Gene Ontology annotation), the objective of GSEA is to ascertain whether the genes within S are randomly scattered throughout L or are predominantly grouped at either the start or end of L. This sequencing is a reflection of the genes' varying expression levels across distinct phenotypic conditions. Should the genes within the gene set S under investigation be found to be significantly aggregated at the extremes of L, this suggests that these genes play a role in the observed phenotypic variations and are thus the focal point of our analysis.
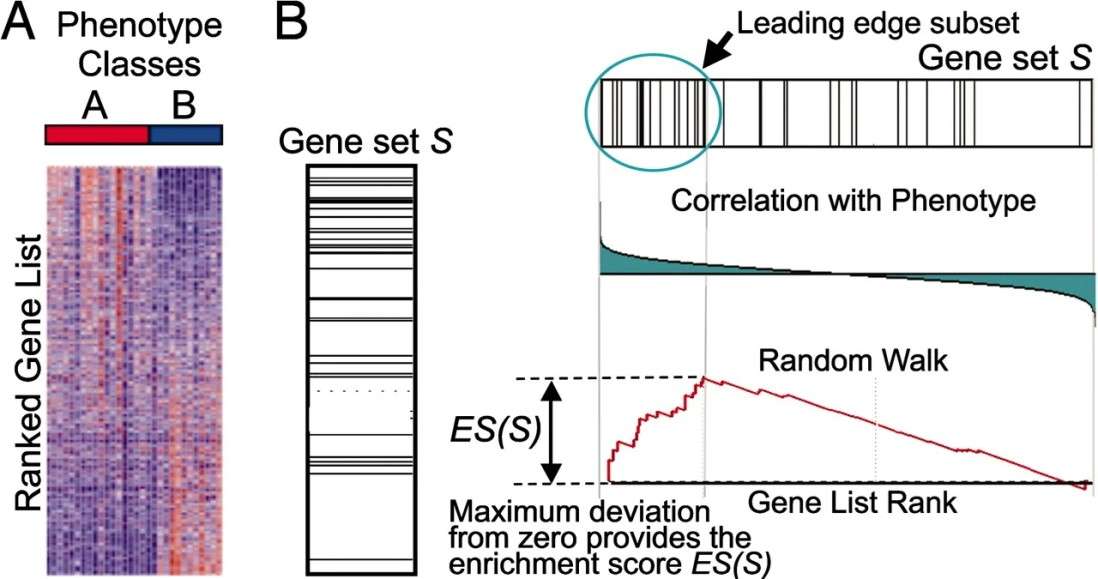 Figure2.A GSEA overview illustrating the method(Subramanian A.,et.al,2005).
Steps to Perform GSEA
- Ranking Genes: To initiate GSEA, genes are first ordered according to their differential expression between two biological states. This process is vital as it lays the groundwork for pinpointing genes with the most substantial alterations, which in turn aids in identifying potentially enriched gene sets. The ranking can utilize diverse criteria, including fold change values, t-statistics, or other statistical indicators that reflect the disparity in gene expression levels.
- Calculating Enrichment Scores (ES): After ranking, compute the Enrichment Score (ES) for gene sets. ES measures the enrichment at list extremes. The calculation involves a cumulative sum that adjusts based on gene set membership and expression changes. The ES is the maximum cumulative sum deviation from zero.
- Statistical Testing: Significance of ES is determined through permutation tests, assessing the probability of random ES extremes. This helps to distinguish chance enrichments from genuine associations. Multiple hypothesis testing corrections, like FDR, are applied to control false positives. The permutation approach varies by sample size and analysis needs, providing adjusted p-values for confidence in enrichment findings.
Applications of GSEA
researchers leveraging GSEA can better interpret data from single-cell RNA sequencing and transcriptomic data analysis to reveal critical insights into cellular pathways.
Cancer Research: GSEA helps identify pathways involved in tumorigenesis, providing insights into potential therapeutic targets.
Drug Discovery: It elucidates molecular mechanisms underlying drug responses, facilitating the identification of novel drug targets.
Functional Genomics: GSEA uncovers the roles of specific gene clusters in biological processes, enhancing our understanding of gene functions.
Popular Tools for Performing GSEA
Several tools have been developed to facilitate GSEA, each with its unique features and capabilities. Below is a table summarizing some of the most popular tools for performing GSEA, highlighting their key
Interpreting GSEA Results
Key Metrics
The Enrichment Score (ES) measures the degree of overrepresentation of a gene set. Other key metrics include the normalized enrichment score (NES) and adjusted p-values to ensure statistical rigor.
Visualization Techniques
- Heatmaps: Heatmaps are graphical representations that use color gradients to display the expression levels of genes within a pathway. They are particularly useful for identifying clusters of genes that are differentially expressed and contribute to the enrichment score.
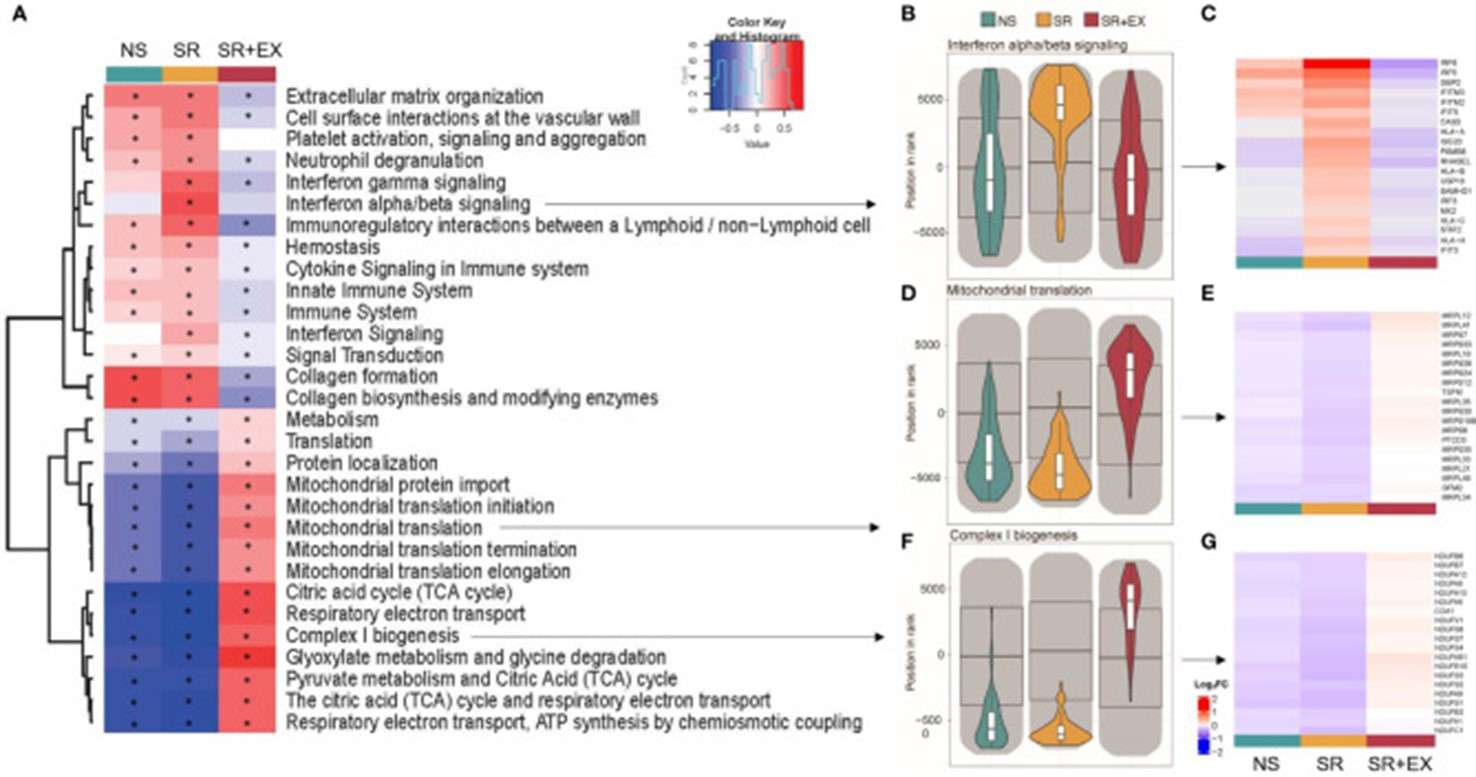 Figure3.Heatmap representing the top 30 significantly altered gene sets(Lin, W.,et.al,2022).
- Pathway Maps: Pathway maps provide a visual framework for understanding the interconnectedness of enriched pathways. These maps often include nodes representing genes or gene products and edges representing interactions between them.
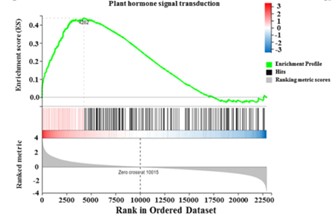 Figure4.GSEA enrichment analysis of genes related to plant hormone signal transduction pathway(Wang, Y.et.al,2021).
Conclusion
Gene Set Enrichment Analysis is a cornerstone of modern bioinformatics, empowering researchers to uncover meaningful insights from high-throughput genomic data. By leveraging robust tools and services, such as those offered by CD Genomics, researchers can enhance their understanding of gene expression and pathway dynamics.
References:
- Subramanian, A., Tamayo, P., et.al. (2005). Gene set enrichment analysis: a knowledge-based approach for interpreting genome-wide expression profiles. Proceedings of the National Academy of Sciences of the United States of America, 102(43), 15545–15550. https://doi.org/10.1073/pnas.0506580102
- Liberzon, A., Birger, C., et.al. (2015). The Molecular Signatures Database (MSigDB) hallmark gene set collection. Cell systems, 1(6), 417–425. https://doi.org/10.1016/j.cels.2015.12.004
Comments